



Is your business performing well and maintaining good financial health? You can find out the answer by tracking accounts receivable metrics.
These accounts receivable performance metrics help you to gain insights into the collection efficiency and payment trends. It also allows you to understand the customer behavior, reduce the debt, and make informed decisions.
However, tracking a single metric will not capture the full picture. There are various KPIs that you must monitor to get the scenario.
📌 Key takeaways
- AR metrics refer to performance indicators that measure your business’s efficiency in managing invoices and collecting payments.
- Some major KPIs for accounts receivable include the accounts receivable turnover ratio, the collection effectiveness index, and the bad debt ratio.
- Business professionals can gain real-time visibility into outstanding invoices with the accounts receivable KPI dashboard.
- Continuous monitoring of these KPIs helps to identify the collection bottlenecks and other areas for improvement.
- Incorporating automation into the accounts receivable metric delivers high accuracy and real-time visibility.
What are the accounts receivable metrics?
Accounts receivable metrics are KPIs that indicate the company’s ability to manage invoices, credits, and payment collections. It means how efficiently and effectively your business collects customers’ payments and manages outstanding revenue.
Accounts receivable turnover ratio, days sales outstanding (DSO), collection effectiveness index (CEI), and bad debt ratio (BDR) are some common AR metrics. Monitoring these KPIs helps business professionals make informed decisions about collecting payments and improving overall financial performance.
According to a Deloitte report, a survey indicates that about 54% of CFOs say integrating AI agents into finance will be one of their top priorities in 2026 or in the coming time as part of finance transformation.
Overview of accounts receivable metrics KPIs
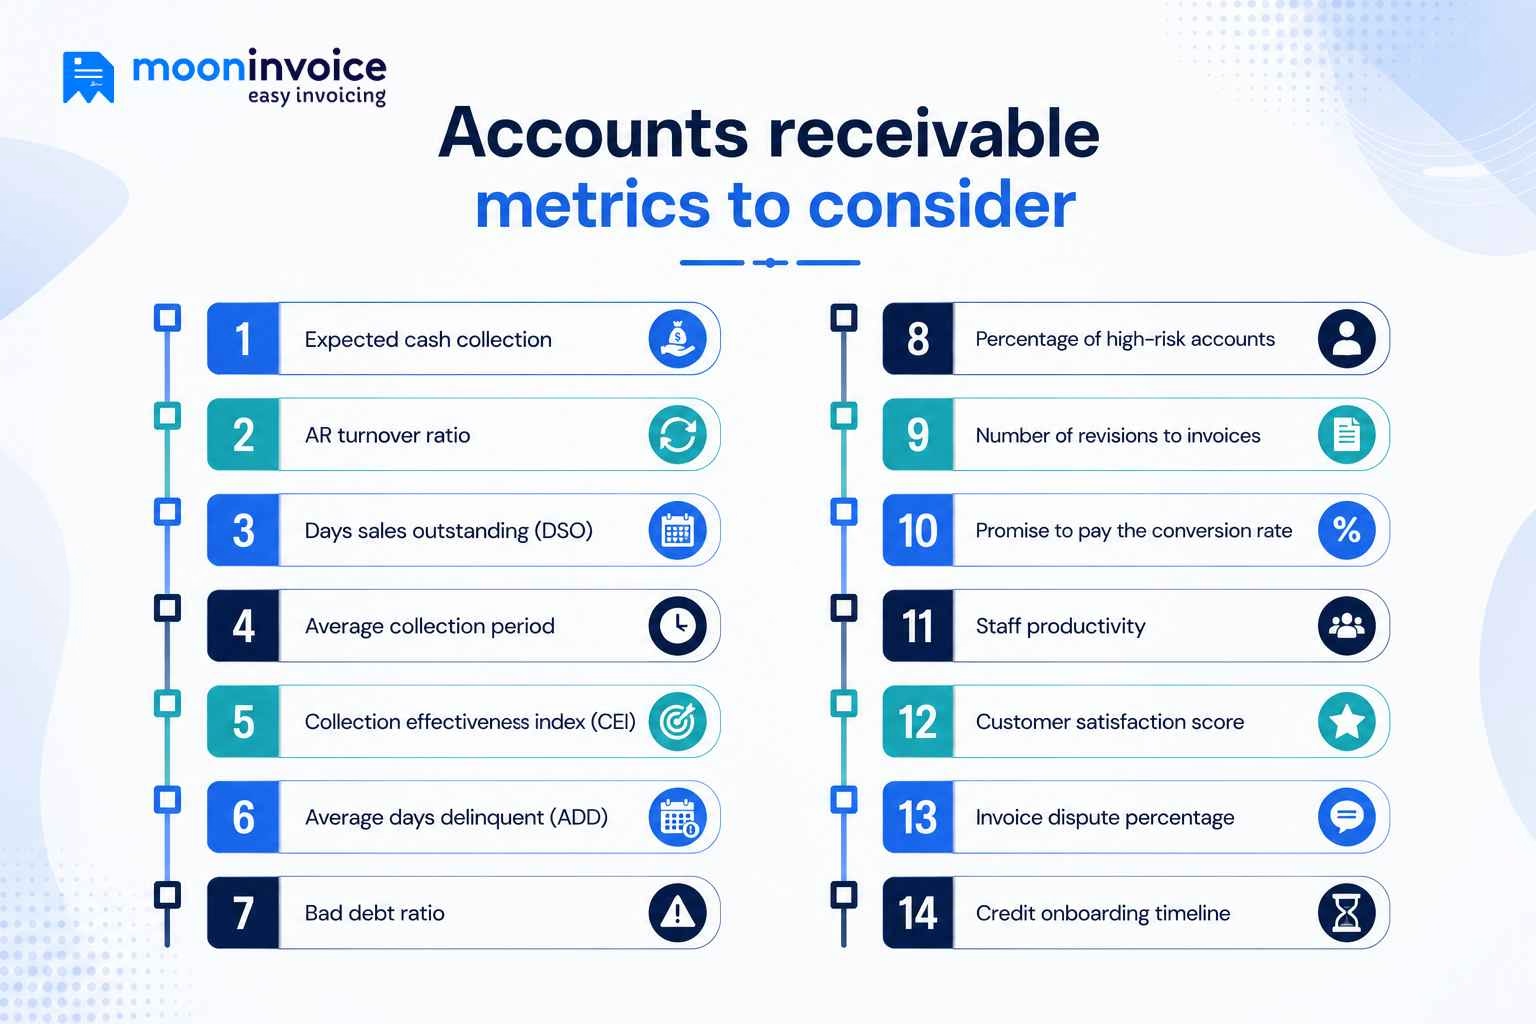
Get a quick overview of important AR metrics, including their formulas and ideal benchmarks.
| S.No. | KPI | Formula | Ideal range |
|---|---|---|---|
| 1 | Expected cash collection | Expected cash collection = Cash sales + Projected AR collection | 95% to 99% |
| 2 | AR turnover ratio | Accounts receivable turnover ratio = Net credit sales ÷ Average accounts receivable | 5 to 8 |
| 3 | Days sales outstanding (DSO) | DSO = (Accounts receivable ÷ Total credit sales) x No. of days | 35 to 45 days |
| 4 | Average collection period | Average collection period = (Accounts receivable ÷ Annual credit sales) x 365 | 30 to 45 days |
| 5 | Collection effectiveness index (CEI) | CEI = ((Beginning AR + Credit sales – Ending total AR) ÷ (Beginning AR + Credit sales – Ending current AR)) x 100 | 80% to 90% |
| 6 | Average days delinquent (ADD) | ADD = DSO – Best possible DSO | under 15 to 20 days |
| 7 | Bad debt ratio | Bad debt ratio = (Amount of bad debt ÷ Total sales) x 100 | 1% to 2% |
| 8 | Percentage of high-risk accounts | Percentage of high-risk accounts = (No. of high-risk accounts ÷ Total no. of accounts) x 100 | 0% to 10% |
| 9 | Number of revisions to invoices | Invoice revision rate = (Total no. of revised invoices ÷ Total no. of issued invoices x 100) | 0% to 5% |
| 10 | Promise to pay the conversion rate | Promise to pay the conversion rate = (No. of kept payment promises) ÷ (Total no. of payment promises made) x 100 | 70% to 95% |
| 11 | Staff productivity | Staff productivity = Total AR tasks completed ÷ No. of AR staff members | 30 to 60 invoices per day per employee |
| 12 | Customer satisfaction score | Customer satisfaction score = (No. of satisfied customers ÷ Total no. of survey responses) x 100 | 70% to 100% |
| 13 | Invoice dispute percentage | Invoice dispute percentage = (No. of the disputed invoice ÷ Total invoices issued) x 100 | 1% to 5% |
| 14 | Credit onboarding timeline | Credit onboarding timeline = Total time taken to onboard new credit customers ÷ No. of credit customers onboarded | 1 to 7 days |
Top 14 accounts receivable metrics to track for your business finance
1. Expected cash collection
This refers to the estimated amount of cash that your company can receive from the outstanding invoices and sales for the period. Therefore, the finance team can forecast the cash flow and plan their budget accordingly.
There are two primary sources of expected cash collection:
- Cash sales – Cash received immediately upon payment by the customer for the sale.
- Accounts receivable collections – The expected amount of payment that the customer pays as credits.
Expected cash collection formula
Example
Let’s say your company makes the sale, receives $4,000 in payment, and has an outstanding invoice for $6,000. You assume that your customer will pay in credits for these invoices. The expected cash collection will be as follows:
Expected cash collection = $4,000 + $6,000 = $10,000
2. AR turnover ratio
The accounts receivable turnover ratio indicates your company’s ability to collect payments. The average number of collections can be calculated weekly, monthly, or quarterly. A higher AR turnover ratio is a good sign, indicating rapid payment collection.
AR turnover ratio formula
Here,
Example
Suppose a company makes the net credit sales of $50,000, and its average accounts receivable is $3,000. Calculating AR turnover ratio as per the formula –
Accounts receivable turnover ratio = $50,000 ÷ $3,000 = 16.6
3. Days sales outstanding (DSO)
Days’ sales outstanding refers to the average number of days the company takes to collect payment. It means a higher DSO indicates a longer time to receive payment and collection challenges, and a lower DSO indicates a shorter time. Therefore, you must aim to maintain DSO as low as possible.
DSO Formula
Example
Suppose a company possesses the following metrics
- Accounts receivable – $20,000
- Total credit sales – $100,000
- Number of days – 30 days
DSO = ($20,000 ÷ $100,000) x 30
= 0.2 x 30 = 6 days
4. Average collection period
This accounts receivable metric indicates the average number of days it takes a business to collect its receivables. This metric uses the average accounts receivable balance over the specific period. This differentiates it from DSO, which is calculated using the ending accounts receivable balance. A low ACP is a good sign as it indicates your business is quickly collecting its payments.
Average collection period formula
Formula 1
Formula 2
Where, Accounts receivable turnover ratio = Net credit sales ÷ Average accounts receivable
Let’s take a real-life example to better understand this metric. Suppose the annual credit sales of the company are $30 million, and the average accounts receivable are $2.5 million. So, the average collection period will be as follows:
Average collection period = (2.5 ÷ 30) x 365 = 30.4 days
Or
Average collection period = 365/(30 ÷ 2.5) = 30.4 days
Does manual handling hinder your accounts receivable management?
Level up it with faster invoices, automated calculations, and better visibility into cash flow with Moon Invoice.
5. Collection effectiveness index (CEI)
The Collection Effectiveness Index (CEI) measures the company’s ability to collect outstanding receivables over a specific period. A higher CEI number indicates that companies are capable of collecting most of their accounts.
Collection effectiveness index formula
Beginning AR – The amount of outstanding AR the company holds at the beginning of the period.
Credit sales – The total sales made on credit for the period.
Ending total AR – The amount of outstanding AR the company holds at the end of the period.
Ending current AR – The total of all payments received for credit sales of the particular period.
Example
Let’s understand it by a real-life example. Suppose a company holds the following values for a month:
- Beginning AR balance – $110,000
- Credit sales of the month – $20,000
- Ending total AR balance – $50,000
- Ending current AR balance – $11,000
Putting all these values together in the formula, we get the collection effectiveness index as:
((110,000 + 20,000 – 50,000) ÷ (110,000 + 20,000 – 11,000)) x 100
80,000 ÷ 119,000 = 0.67 x 100 = 67%
6. Average days delinquent (ADD)
This accounts receivable refers to the total number of days the average amount gets overdue. It means the average gap between the invoice due date and the actual payment date. A higher ADD clearly indicates a high gap in receiving the payment. Therefore, you should aim to keep it as low as possible.
Average days delinquent formula
Example
Suppose for a month of 30 days, a company possesses the following metrics as follow:
- Current accounts receivable – $4,000
- Total credit sales – $10,000
- DSO – 45 days
Best possible DSO = ($4,000 ÷ $10,000) x 45 = 18 days
DSO – Best possible DSO = 45 – 18 = 27 days
7. Bad debt ratio
This is one of the most crucial accounts receivable performance metrics. It indicates the outstanding invoices relative to total sales. Bad debt ratio refers to the portion of receivables or the credit sales that is expected not to be paid by the buyer.
Bad debt ratio formula
Example
Imagine a company has $10,000 in outstanding invoices (bad debt) and made total sales of $500,000 for the month. The bad debt ratio will be as follows:
($10,000 ÷ $500,000) x 100
(0.02 x 100) = 2%
It means 2% of outstanding receivables are not collected.
8. Percentage of high-risk accounts
The percentage of high-risk accounts is the ratio of high-risk accounts to the total number of accounts. Therefore, it indicates the number of risk-oriented customers that contribute to bad debt. A higher percentage of high-risk accounts indicates increasing collection risk and the need to implement strict credit terms. On the other hand, it’s a stronger customer base when this metric is low.
High-risk accounts percentage formula
Example
Suppose a company has 200 accounts. Out of them, 40 are high-risk accounts. Then, according to the formula,
Percentage of high-risk accounts = 40 ÷ 200 = 0.2 x 100 = 20%
9. Number of revisions to invoices
It refers to the number of invoices your AR team needs to revise for the particular period and is calculated as the invoice revision rate. The reason for such a revision could be a change in the payment policy or a correction due to a customer dispute. Therefore, a high frequency of invoice revisions clearly indicates a problem in the invoicing process.
Invoice revision rate formula
Example
Imagine a company issues 1,500 invoices in a month. Out of them, the AR team revised 50 invoices. The invoice revision rate will be as follows:
50 ÷ 1,500 x 100 = 3.3%
10. Promise to pay the conversion rate
Are your customers paying as per the commitment? This accounts receivable KPI is relevant to such a scenario and helps you identify customer intent. A high promise-to-pay conversion rate usually means your customers are paying as promised. On the other hand, a low rate clearly indicates the need for improvement in follow-up.
Conversion Rate Formula
Example
Imagine a company issues 100 invoices for 100 customers who promise to pay. Of these customers, 60 made the payment as promised. So, the PTP conversion rate according to the formula will be as follows:
Promise to pay the conversion rate = 60 ÷ 100 x 100 = 60%
11. Staff productivity
Using this KPI, you can measure the AR team’s ability to manage invoices, track outstanding balances, and collect payments. Staff productivity can be measured by the number of receipts & invoices processed, or collections handled per AR employee. A higher staff productivity rate, which indicates a team’s good capability and better utilization of resources.
Staff productivity formulas
Receipts processed per employee
Invoice processed per employee
Value-based productivity
Example
Suppose the AR team of 5 members in a company completed the following tasks:
- Number of invoices processed – 700
- Payment follow-ups sent – 200
- Number of dispute invoices resolved – 100
Total AR task completed – 1,000
Staff productivity = 1,000 ÷ 5 = 200 tasks per employee
12. Customer satisfaction score
In general terms, the customer satisfaction score is how satisfied your customers are with your accounting process. Thus, it showcases the customer’s experience with invoicing, payment, and the overall billing process. A higher customer satisfaction score indicates greater satisfaction with the payment experience.
Customer satisfaction score formula
Example
Suppose a company surveys 100 customers to assess their satisfaction levels. Out of those 100 customers, 75 are satisfied. The customer satisfaction score will be as follows:
Customer satisfaction score = (75 ÷ 100) x 100 = 0.75 x 100 = 75%
13. Invoice dispute percentage
It is another crucial KPI among accounts receivable metrics, showing the number of invoices disputed over a period due to incorrect pricing, delivery issues, or disagreements during the sale. A higher percentage of invoice disputes clearly indicates cash flow issues and payment delay. Thus, monitoring this metric helps employees to take corrective measures to improve billing.
Invoice dispute percentage formula
Example
Suppose a company issues 2,000 invoices in a month, and out of them, 100 invoices are categorized as disputed.
No. of disputed accounts – 100
Total issued invoices – 2,000
Invoice dispute percentage = (100 ÷ 2000) x 100 = 5%
14. Credit onboarding timeline
Credit onboarding timeline refers to the average time a business takes to assess, approve, and onboard a new customer for the credit payment. A shorter credit onboarding timeline indicates a faster process, whereas a longer timeline indicates a need for improvement.
Credit onboarding timeline formula
Example
Suppose a company onboarded 50 new credit customers in a month. The total time spent processing the application was 100 days.
Credit onboarding timeline = 100 ÷ 50 = 2 days per customer
How to choose the right accounts receivable KPIs for your business?
Selecting the right accounts receivable KPI for your business always starts with understanding your cash flow and business goals.
Align KPIs with business objectives
Find out which KPIs best suit your business objectives and challenges. So here, you must be clear about your goal: whether you want to improve cash flow or reduce bad debt. Also, you need to evaluate your AR process to detect the challenges. This approach eases your selection of KPI.
Examine the customer payment behavior
Include the KPIs, such as Average Days Delinquent (ADD) and Invoice Dispute Percentage (IDP). These metrics help track the customer payment behavior and also associated potential collection risks.
Incorporate and leverage automation
Track and analyze the KPIs in real-time AR software. This enhances the speed of the process and improves accuracy. With real-time data, you gain the visibility you need into collection performance and can make informed decisions.
Regular review and adjustment
The business objectives change over time. Therefore, it is necessary to periodically review your chosen KPIs. If necessary, make the required adjustment. This helps you to keep your accounts receivable strategy effective and relevant.
Improve AR efficiency and visibility with Moon Invoice
No matter what the size or nature of your business, tracking KPIs for accounts receivable is essential. It helps businesses detect collection bottlenecks, gain valuable insights for improvement, and make data-driven decisions.
Additionally, improving these KPIs is the next step for your company’s good financial health. Moon Invoice, trusted by 1.7M+ businesses worldwide, can be your true partner in enhancing your AR KPIs.
This invoicing software offers a centralized platform to manage all your billing data in a single, systematic system. It’s 66+ customized invoice templates help you create clean, professional invoices. Also, the auto-calculation feature ensures high accuracy across all invoices. As a result, it reduces DSO and the invoice dispute rate.
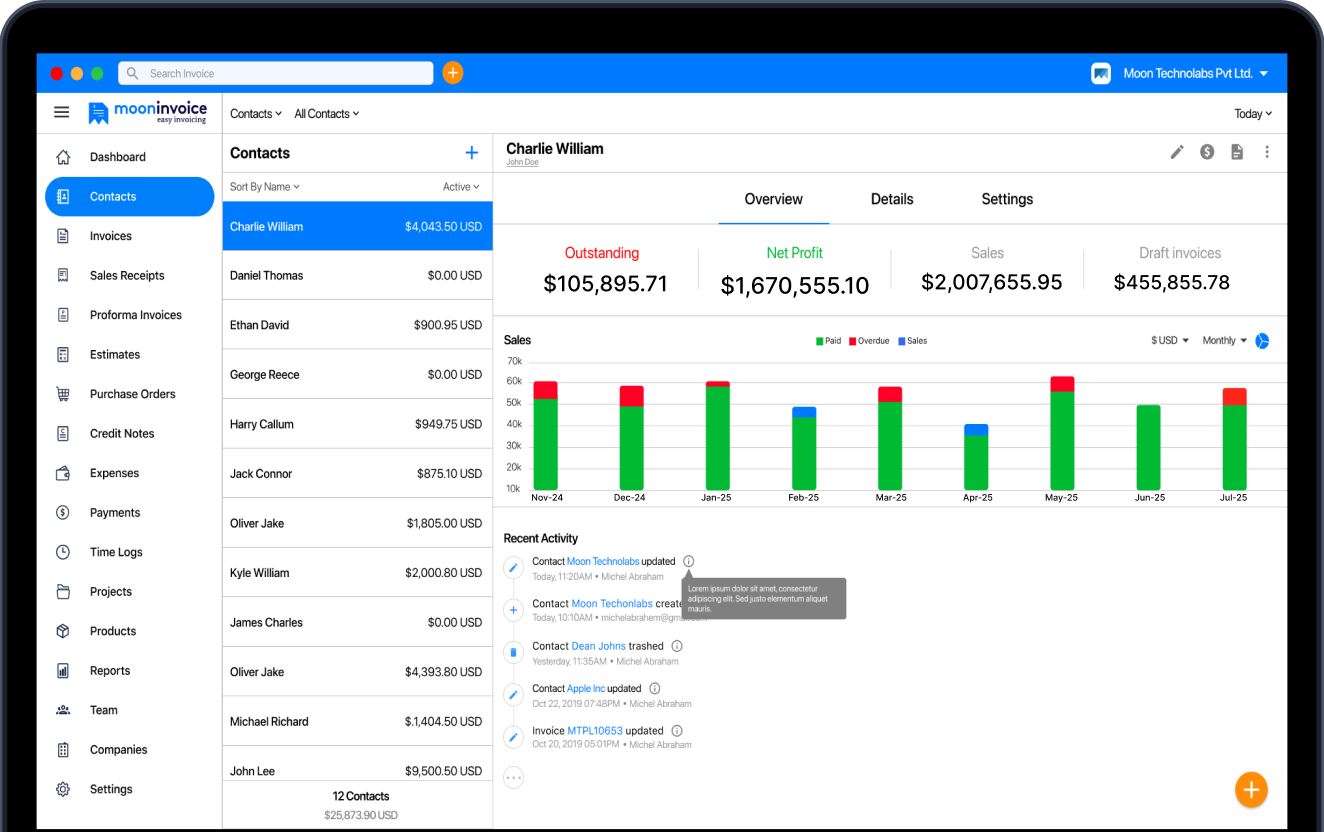
The system provides real-time tracking, enabling you to easily monitor paid and outstanding invoices. You can make better decisions to improve collection planning and achieve a higher Collection Effectiveness Index (CEI) score. It automates the payment reminder process, ensuring customers pay on time.
Overall, businesses can easily reduce payment delays and strengthen cash flow management, both of which directly impact AR metrics.
Do you want to take your business billing to the next level?
Choose Moon Invoice to streamline your payment processing on every transaction.
Professional invoices
Automated follow-ups
Faster payments
Quick questions on accounts receivable metrics
What are the KPI metrics for accounts receivable?
What are the 5 C’s of AR management?
How often should accounts receivable metrics be monitored?
What is a healthy benchmark for AR metrics in 2026?



We at Moon Invoice, are the best minds behind smarter invoicing and seamless business growth. We love to solve financial problems and keep providing effective tips through our blogs, newsletters, and social media channels. As a team, we continue exchanging ideas about growing financial challenges and smart use of automation tools.